The Advantages of Concept Maps

Concept maps have become a well-known tool for expressing concepts and ideas visually. Using these maps to express your ideas or concepts has many benefits for both presenters and viewers who are trying to learn. It helps improve understanding and comprehension and makes it easy to demonstrate the link between the various elements in a concept or idea.

This article discusses concept maps, and the main advantages of concept maps.   

What is Concept Map? 

A concept map is the visualization of a concept or idea using diagrams, tables, or graphical tools. It uses images and symbols to explain an idea. It shows how different aspects of an idea or concept relate. 

A majority of concept maps illustrate the different working components behind a concept organized hierarchically and linked by lines or arrows (also called arcs). The lines, labelled with connecting words and phrases, help to display the links between concepts.

The basic features of a concept map

Concept maps have certain characteristics that differentiate them from other diagrams and visualizations. The following are the main features of a concept map:

  • The Concept/s

Since every concept has different working components, they need to be organized hierarchically using shapes like boxes, circles, or rectangles. 

  • Hierarchical Structure 

Concept maps are arranged based on the hierarchy of ideas.

  • Linking Words/Phrases

Linking words or phrases follow the lines connecting objects in a concept map. They describe the relationship between two concepts and are kept concise.

The benefits of using a concept map

They are very useful for teaching students how to orgainze their thinking about different topics and concepts. The benefit of concept maps is that they can be tailored to practically any course or design. They provide students with a hands-on exercise that keeps them engaged throughout courses. The following are some advantages of using concept maps:

Helps in making presentations 

Concept maps to aid in organizing ideas and making presentations. They follow a logical path and concise format to visualize ideas. They serve as a guide for developing short, analytical presentations. Concept maps can even be used by presenters to help structure their presentation notes, even if they do not exhibit them during the presentation.

Makes it easy to interpret a concept

Visualizing information, makes it easily understandable quickly. Compared to reading books, it’s much easir to grasp ideas or concepts by using concept maps. Since concept maps are concise and highlight the key points, people can easily skim through and understand the entire system.

Helps visualize your end goals 

Since cross-links demonstrate the link between concepts, they clarify how one may influence another. This assists in making decisions regarding the overall advantages of a plan. It can also assist people in understanding the potential indirect consequences of an action or programme.  

Structures your Concept Hierarchially 

Organized based on the hierarchy of ideas, concept maps usually go from top-to-bottom. With the most general ideasdisplayed at the top, progressing into smaller details. This feature helps people understand the relationship between ideas and how they link. 

Concepts start at a point, and branch off into sub-categories, eventually leading to the end goal.

Advantages of concept maps

Explains The Relationship between different elements of a concept  

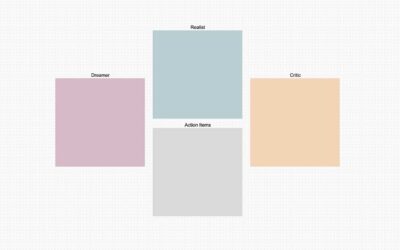
Concept maps help explain the link betweem ideas and concepts. The relationship between each idea can have single or multiple sub-categories. To illustrate how concept maps explain the relationship between ideas, here’s an example:

Endnote

Concept maps are excellent visualization tools that help explain concepts in a format that is easy to understand. They use diagrams, symbols, arrows, and linking words to show the relationship between ideas in a concept. Concept maps are particularly useful for teams that intend to work collaboratively.

To learn more about how you can use frescos online whiteboards to collaborate with your teams, follow the link! 

Categories:

Tags:

Fresco Logo

Fresco is focused on visual collaboration with a mission to expand the possibilities of teamwork online.

contact@frescopad.com

Categories

Recent Posts

Learn More

Scope creep is a term that refers to the expansion of scope throughout the course of a project. Learn how to avoid it by using Fresco.

A fishbone diagram is a template that breaks down problems in a way that helps teams identify and address the root cause of an issue.

The Agile methodology is a workflow that emphasizes cyclical improvements, collaboration, and frequent adaptation in order to solve problems.

Mind Maps present a unique solution to brainstorming and offer an intuitive structure to help you retain information. Learn more on Fresco.

Stakeholder mapping is the process of identifying, diagramming, and prioritizing stakeholders by analyzing their influence over and interest in a project

Online whiteboards do an incredible job connecting workspaces and engaging people in various collaboration activities. Learn more on Fresco.

Visual collaboration enables people to expand their connection globally, and unlock a world of new capabilities. Read to find out just what is possible.

With the workplace changing permanently, people must adapt to embrace virtual activities. Learn how to optimize your next virtual workshop at Fresco!

What is a Fishbone Diagram? Fishbone diagram (also known as the Ishikawa diagram) is defined as a ‘casual diagram’ methodology that aims to find root

What is Ansoff Matrix? Ansoff Matrix is defined as an enterprise growth planning method that aims to find new growth avenues. These growth avenues are

What is PESTEL Analysis? PESTEL analysis is defined as a business impact study that aims to understand the effects of 6 key external factors, which