Empathy Map Template – How To Build an Empathy Map

If you are working on a project and want to make it impactful for yourself and your team, you need to adopt strategies that can help you for a longer time. To create a long-term impact, it’s crucial that you understand the feelings and motivations of your users. Breaking down these important attributes is inherent to the empathy map template, and in this article, we will walk through all the unique parts of how to build one. 

Empathy Map Template in Depth

To know more about an empathy map and the basic elements of an empathy template, we will analyze an empathy map template, how it is created, and what you need to do to make an empathy map work for you. 

Empathy Map Template Essentials

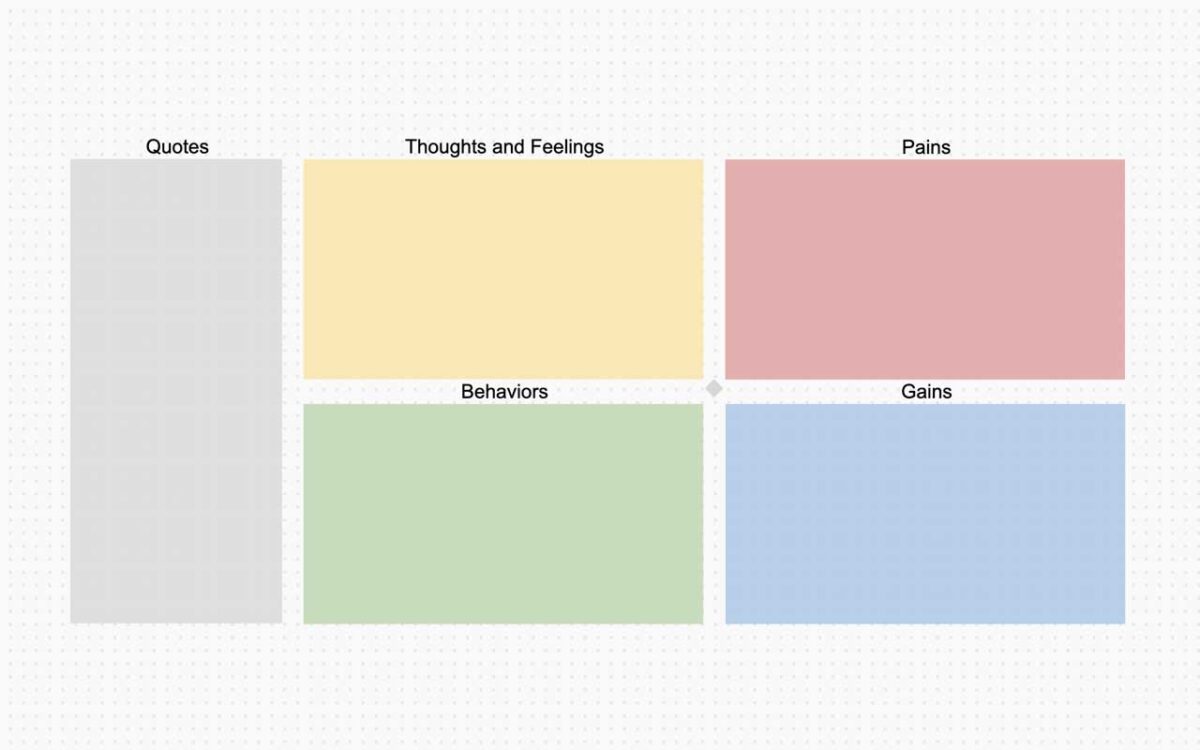
To build an empathy map template, you need to have a clear idea of what your customers want, who they are, and what frustrates them about your product. This can be created via a persona map and an empathy map template. These templates are critical when creating empathy for your customer and visualizing this feedback on a shared board. The visualization of customer feedback helps you collaborate with others on a shared interface and introduce multiple perspectives to the board, which is critical when analyzing user feedback. Now that we know what is vital to interact on an empathy map template let’s break down the essential stages of completing one.

Persona

Before analyzing user feedback, you need to address the principal user you are documenting. This persona can be transferred over from a persona map or can be built within this session. Depending on the scope of your empathy map template, this user will either represent a single user, a niche group, or a large assortment of users. Ensure that the user feedback you analyze matches the user persona you’re targeting because your work will target changes towards your chosen persona.

Says

The first section to analyze is the “says” section. This encompasses all of the direct feedback you get from your users concerning their use of the product and will also include what they say to other people they use the product with. Ideally, this feedback will be gathered from a usability study and will include direct quotes from the user.

Some important questions to ask here could be:

  • What does the user say about the product?
  • Is their feedback generally positive or negative?
  • Who do they talk to in relation to our product?

Thinks

The “thinks” section will mainly consider what the user thinks throughout their journey with the product. This will ideally be gathered from qualitative research conducted but can occasionally be informed by direct user feedback. It’s important to emphasize that some things in the thinks section can overlap with the says section, but this quadrant will also include things the user might not feel comfortable verbalizing.

Some important questions to ask here could be:

  • What does the user think about the product?
  • Is what they think different from what they say?
  • Is there anything they think that they might not be willing to verbalize? Why is this? 

Does

The does section is primarily concerned with the actions taken by the user. This will be informed both by user feedback and product feedback, as you can track users’ activity across the product.

Some important questions to ask here could be:

  • What does the user do with the product?
  • Are their actions taking them closer to reaching their goals?
  • How do they go about conducting their actions?

Feels

The feels section is the last quadrant in the empathy map template and is arguably the most important. This section focuses not on what the user thinks or says but what they feel. This feeling could be about specific actions or about using the tool in general, so it’s important to specify what feelings map to what actions.

Some important questions to ask here could be:

  • What does the user feel throughout their journey?
  • What specific steps are frustrating them?
  • What simple changes can w make to alleviate feelings of frustration?

Conclusion

After you’ve completed all of these quadrants, it’s time to find some action items and begin changing your user’s experience for the better. If you liked this article, make sure you read more about empathy maps in design thinking and their various benefits.

Categories:

Tags:

Fresco Logo

Fresco is focused on visual collaboration with a mission to expand the possibilities of teamwork online.

contact@frescopad.com

Categories

Recent Posts

Learn More

Scope creep is a term that refers to the expansion of scope throughout the course of a project. Learn how to avoid it by using Fresco.

A fishbone diagram is a template that breaks down problems in a way that helps teams identify and address the root cause of an issue.

The Agile methodology is a workflow that emphasizes cyclical improvements, collaboration, and frequent adaptation in order to solve problems.

Mind Maps present a unique solution to brainstorming and offer an intuitive structure to help you retain information. Learn more on Fresco.

Stakeholder mapping is the process of identifying, diagramming, and prioritizing stakeholders by analyzing their influence over and interest in a project

Online whiteboards do an incredible job connecting workspaces and engaging people in various collaboration activities. Learn more on Fresco.

Visual collaboration enables people to expand their connection globally, and unlock a world of new capabilities. Read to find out just what is possible.

With the workplace changing permanently, people must adapt to embrace virtual activities. Learn how to optimize your next virtual workshop at Fresco!

What is a Fishbone Diagram? Fishbone diagram (also known as the Ishikawa diagram) is defined as a ‘casual diagram’ methodology that aims to find root

What is Ansoff Matrix? Ansoff Matrix is defined as an enterprise growth planning method that aims to find new growth avenues. These growth avenues are

What is PESTEL Analysis? PESTEL analysis is defined as a business impact study that aims to understand the effects of 6 key external factors, which