Gantt Chart vs Kanban: Similarities, Differences, & Use Cases

Earlier, industries planned their projects manually. However, the advance in technology now contributes to an automated project management. To visualize and coordinate tasks, some project teams and companies use Gantt charts, while some use other alternatives, of which a Kanban board is one. Teams who are new to handling tasks with project management tools might be wondering if one is better than the other. Hence, we compiled this blog post to show you the use cases of Gantt Chart vs Kanban, through their similarities and differences.

Similarities between Gantt Charts and Kanban

Though they are different tools, the Gantt chart and Kanban share certain similarities:

Visualization

Both tools have a visualization feature. The feature gives teams the chance to move abstract ideas from their minds onto a tool that every team member can interact with. 

Likewise, team members can easily see what tasks they should work on, the duration, milestones, etc.

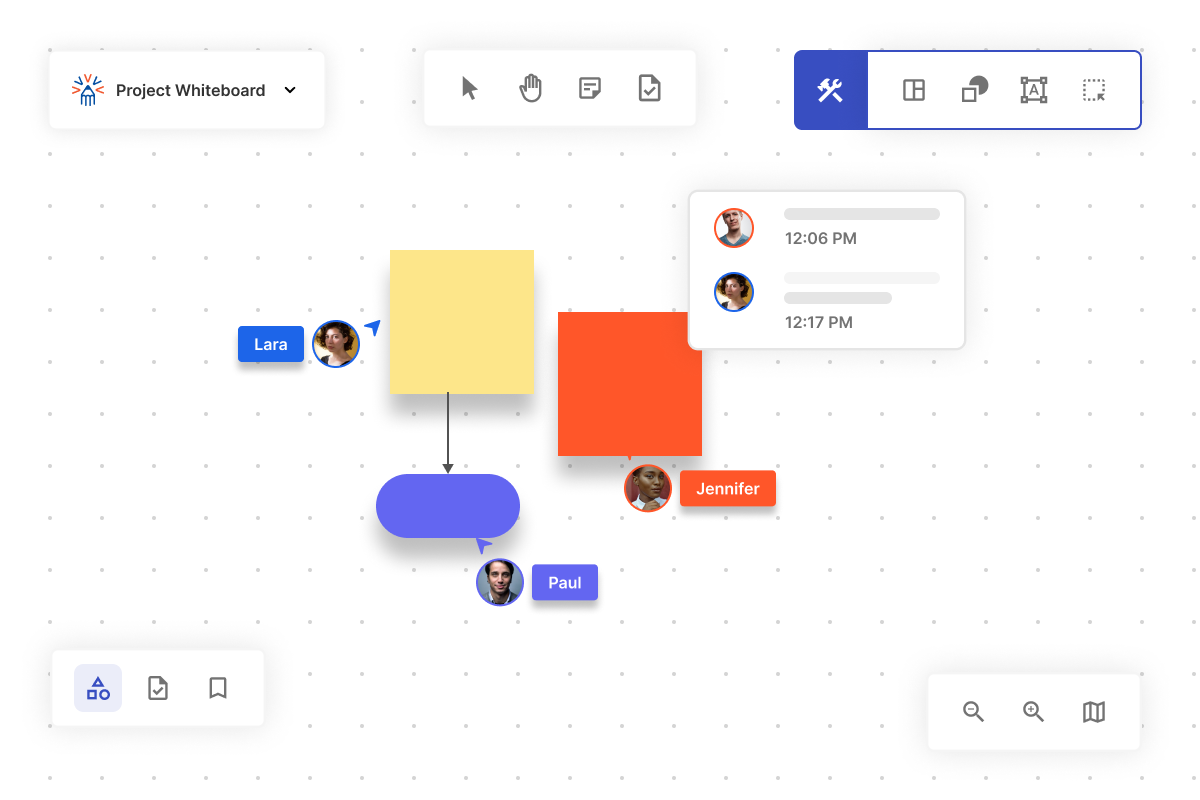
Teams can use different software or online whiteboards to create Gantt charts. They could even use whiteboards in their office spaces. The same goes with a Kanban board.

Task Tracking

Teams can monitor the progress of their projects on both tools. A Gantt chart and a Kanban board display completed tasks and what is left to do. It helps your team determine if they are on the right track as they work on their project allocations.

Awareness

Every project-related information is input on the Gantt chart and Kanban board. Therefore, every project team member will stay up to date on crucial information, including major changes.

Flexibility

As a Gantt chart and a Kanban board are not engraved stones, they give room for changes when necessary. At times, stakeholders could decide to alter some parts of their projects, affecting the preliminary schedule. These changes could even include reassigning tasks or extending project timelines.

Differences between Gantt Charts and Kanban

Gantt chart vs Kanban differ in the following ways:

Dependencies

Tasks managed by Gantt charts are interdependent, while those on Kanban boards are not. Gantt charts show relationships between all tasks that a project requires but does not do the same on Kanban boards. This is because tasks presented on Kanban boards are dependent.

Task Presentation

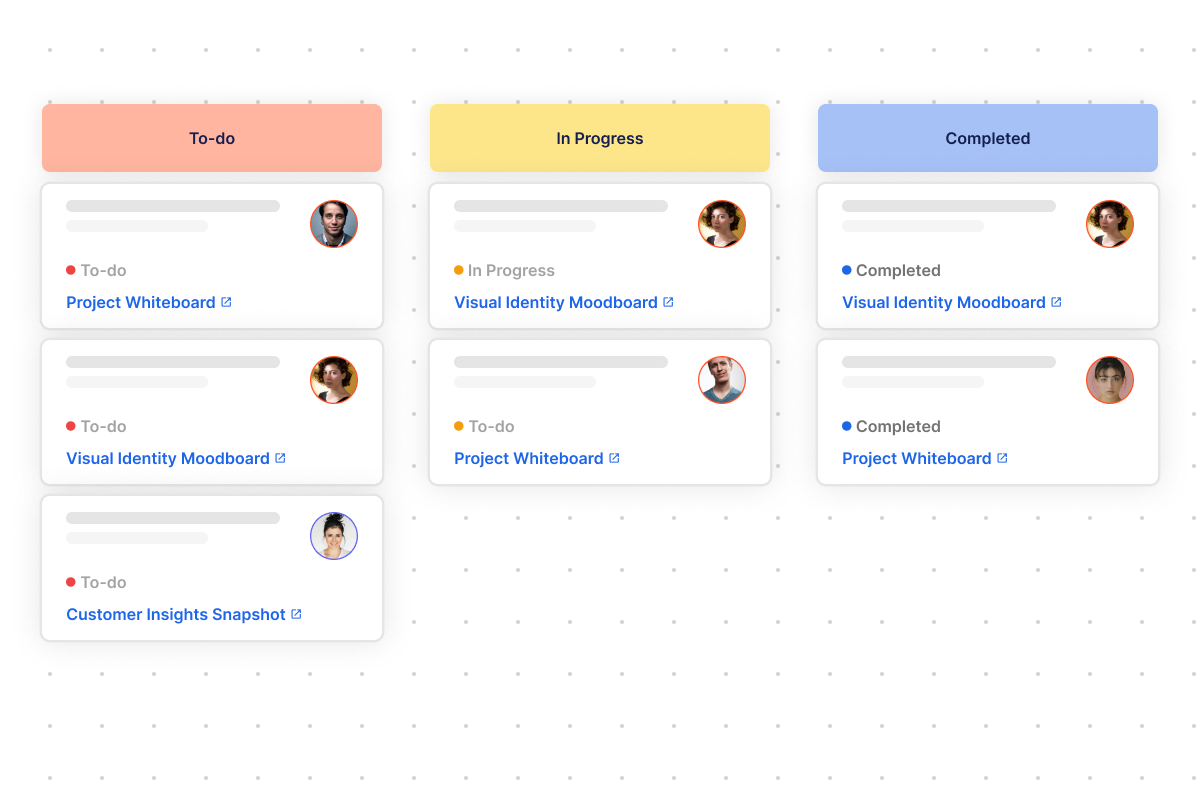
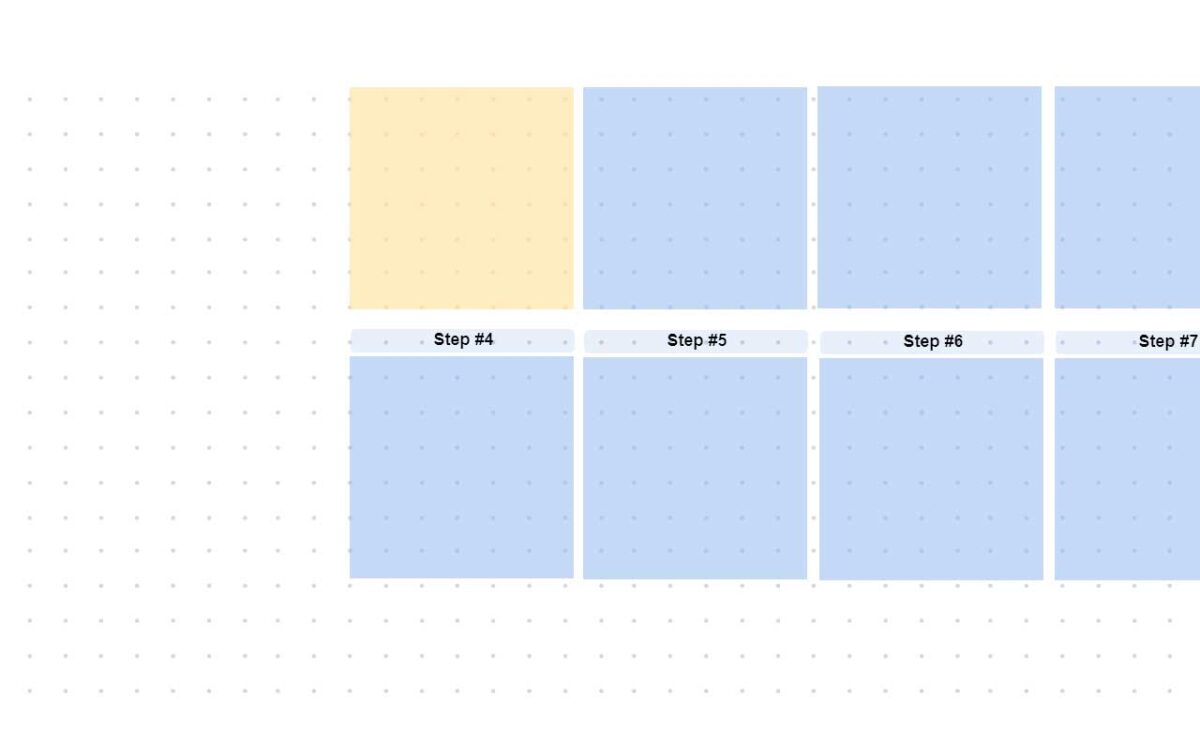
Gantt charts present project information on charts, while Kanban uses columns. These columns are divided into three: To Do, Doing, and Done.

The Kanban board uses stickers to represent tasks, while the whole column stands for a workflow. On the Gantt chart, tasks are not divided this way. They are all listed out while teams monitor their progress by checking the timeline.

Planning

Planning methods on Gantt chart vs Kanban differ. You can plan as you work with a Kanban but you can’t do the same on Gantt charts.

To use a Gantt chart, your team must have a complete plan. There can be no addition, only tweaks. On the other hand, a Kanban board lets you add new activities while reordering the columns.

Context

Teams use Gantt charts to manage projects. Kanban boards, on the contrary, can manage daily businesses like manufacturing. Gantt charts only focus on big projects that you can break into components.

When it is time to manage projects or day-to-day activities, Gantt charts and Kanban boards will cater to your needs. We are available to help your team when you’re ready. Use our Kanban board today and make your team productive.

Featured Image

Categories:

Tags:

Fresco Logo

Fresco is focused on visual collaboration with a mission to expand the possibilities of teamwork online.

contact@frescopad.com

Categories

Recent Posts

Learn More

Scope creep is a term that refers to the expansion of scope throughout the course of a project. Learn how to avoid it by using Fresco.

A fishbone diagram is a template that breaks down problems in a way that helps teams identify and address the root cause of an issue.

The Agile methodology is a workflow that emphasizes cyclical improvements, collaboration, and frequent adaptation in order to solve problems.

Mind Maps present a unique solution to brainstorming and offer an intuitive structure to help you retain information. Learn more on Fresco.

Stakeholder mapping is the process of identifying, diagramming, and prioritizing stakeholders by analyzing their influence over and interest in a project

Online whiteboards do an incredible job connecting workspaces and engaging people in various collaboration activities. Learn more on Fresco.

Visual collaboration enables people to expand their connection globally, and unlock a world of new capabilities. Read to find out just what is possible.

With the workplace changing permanently, people must adapt to embrace virtual activities. Learn how to optimize your next virtual workshop at Fresco!

What is a Fishbone Diagram? Fishbone diagram (also known as the Ishikawa diagram) is defined as a ‘casual diagram’ methodology that aims to find root

What is Ansoff Matrix? Ansoff Matrix is defined as an enterprise growth planning method that aims to find new growth avenues. These growth avenues are

What is PESTEL Analysis? PESTEL analysis is defined as a business impact study that aims to understand the effects of 6 key external factors, which