What is a Gantt Chart? A Comprehensive User Guide.

Gantt chart

Planning is the bedrock of a project’s success, as we all know that a goal without a plan is just a wish. Without planning, individuals and companies will record massive failures at whatever they do. That’s where Gantt chart comes in!

Organizations must create a plan that allows a strategic execution of projects to avoid failure. Therefore, this guide will cover what a Gantt chart is, its components, and alternatives. You’ll also discover when to use a Gantt chart and how to create one in Excel.

What is a Gantt Chart?

A Gantt chart is a tool used to plan, schedule, and monitor a project. The chart represents a series of information in both horizontal and vertical axes. Through it, team members have access to several pieces of information that will aid project management.

Project team members can use a Gantt chart to view tasks at hand, task schedules, dependencies, progress, and milestones. The vertical axis on the chart outlines available projects, while the horizontal axis represents task duration.

Karol Adamiecki first introduced the tool in the 1980s after showing interest in management ideas and techniques. Similarly, Henry Gantt, a project management consultant, developed the tool version fifteen years later.

At the time, people created the chart by hand. Today, teams now create Gantt charts on computers with software for project management. The charts can be shared, easily adjusted, and even printed. The Gantt chart is named after Henry Gantt.

Components of a Gantt Chart

Without putting in the right information, a tool or idea will not function optimally or represent what it should. Take a PowerPoint presentation, for example. Without the use of text on slides, it will be impossible to create a .pptx file.

The same applies to a Gantt chart. This section will outline the items that a Gantt chart should possess when used for project management.

– Tasks Breakdown

In the Gantt chart, team members can thoroughly break down every task related to a project. For instance, if a team wants to develop a mobile app, the chart will break the project down into different tasks.

These tasks will include strategy, analysis, UI/UX design, development, etc. This breakdown (into groups & subgroups) represents a task list.

Start and End Dates

Teams that use a Gantt chart can indicate tasks’ starting and completion dates. Going back to our example, the strategy phase of the app development process should have a time it will start and when it should finish.

An example of this is April 3-April 7, 2022. This date signifies that the starting date for the mobile app development strategy is April 3rd. Then the completion date is April 7th.

Duration

Duration means how long a project will take. You calculated by noting the number of days from the beginning to the end of a project. In the previous example, the start date is April 3rd, while the end date is April 7th.

Therefore, the duration of the strategy stage is five days. This timeline shows on the horizontal axis. It could be in days, weeks, and months. The project at hand determines the timeline.

– Assigning of Tasks

It is important to assign tasks to different project team members based on their talents and departments. This guarantees effectiveness and efficiency. For app development, for instance, different departments will handle its various stages.

The design team will handle UI/UX, while the development team will handle the app development. In short, it shows who is responsible for what on a project.

Task Interdependence

Each project team cannot operate in isolation. Teams need to connect with other teams to ensure the success of a project. Indirectly, tasks are mutually-reliant on one another. A Gantt chart shows the relationship between one task and the rest.

Schedules

On a Gantt chart, project teams get to know when important meetings and briefings will hold. It will also state the deadline for each task.

Work Progress

After teams have noted the various parts of a project to finish, monitoring work progress is important. Team members should study which tasks have been fulfilled and see what is left to make a project successful.

Gantt Chart Alternatives

Using a Gantt chart for executing projects and carrying out tasks is great. Plus, buying a Gantt chart software can be out of the roof, thereby discouraging financially-incapable companies.

Moreover, after reading up on some of its liabilities, your company might want to take another route to manage its projects. This section will outline some other alternatives which will work impressively for your project management.

Scrum Board

The Scrum Board is the visible indicator of the status of a project. Scrum teams work by paying attention to sprints. These sprints are the timeframe of a project. Sprints could be anywhere between a week and four weeks.

Often, software development teams work on a 2-week sprint. Unlike tracking the success of a project on the Gantt chart, Scrum teams check their timeline on the Scrum board.

The Scrum board is not a sophisticated tool for project management. It is just a whiteboard or a wall space. It has 3 columns: To Do, Doing, and Done. Teams use sticky notes to mark each column/phase.

This visualization feature shows teams how fast or well they are progressing. It shows what has been done and what is left to do. With this, teams become more efficient, organized, and quick at decision-making.

Project Management Checklist

Can you take a couple of minutes to imagine how much wool goes into a stuffed toy? Similarly, a lot goes into project management. These elements make up a project management checklist.

To start with, your company should document its project goals and objectives. These goals should reveal what your company aims to achieve and the problems it wants to solve.

These goals must be SMART (specific, measurable, achievable, realistic, and time-bound). Determining this will help your company identify project deliverables and the problem-solving method to use.

The next step to take is to meet with stakeholders and project managers. The stakeholders could include your company’s management, vendors, and clients. Your project team should meet them and share project updates with them.

Furthermore, put together result-oriented criteria for the project management. Plan your project, make a budget, allocate available resources to teams, and create a schedule for completing tasks.

Set a communication plan to stay abreast of all changes and development. Finally, monitor your progress on the checklist to see how well you are operating within the set deadline.

Project Network Diagram

A project network diagram is a chart that has several boxes and arrows. Your team can also use it to schedule a project’s work sequence and track progress from the start date to the completion date.

This tool helps teams visualize the activities they should complete throughout a project’s timeline. It outlines concepts like task dependency, sequence, and duration.

Today, the frequently-used type of this tool is the precedence diagram method (PDM). In this method, each box stands for an activity. The arrows on it represent the relationship between all the activities on the diagram.

The four basic relationships that are represented on the diagram are FS (Finish to Start), SS (Start to Start), FF (Finish to Finish), and SF (Start to Finish). FS means when an activity cannot start unless another activity finishes.

SS is when two activities can start simultaneously. FF is when two tasks need to finish simultaneously. On the other hand, FS is used when an activity cannot end until another one starts. Unlike other dependencies, FS is uncommon.

Kanban Board

A Kanban board is another visual tool for project management. It is often used by Agile and DevOps teams. A Kanban board has visual signals, columns, and work-in-progress limits. It also has a commitment point and a delivery point.

Visual cards used on a Kanban board include stickers and tickets. Team members write all their tasks on the stickers or tickets to use the Kanban board. One sticker carries one task. These stickers make the board readable and understandable for team members and project stakeholders.

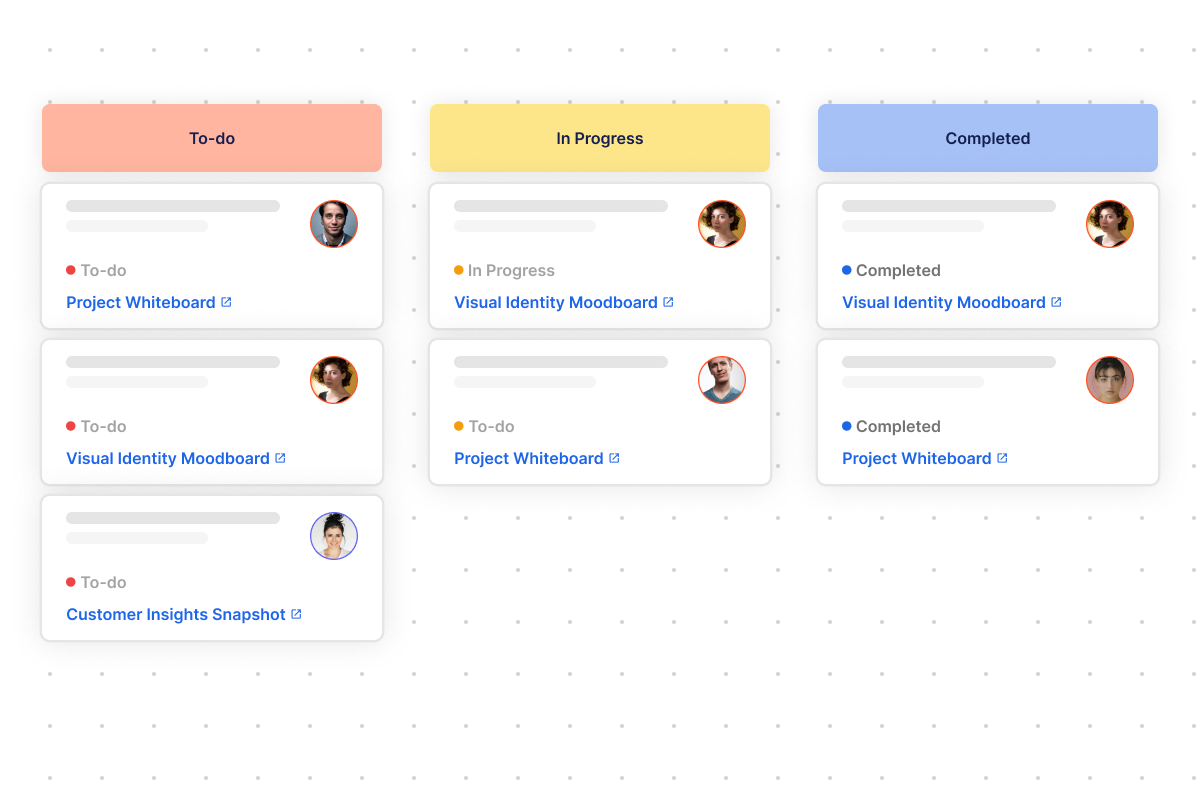
Teams are at liberty to divide tasks into different columns. Those columns could be To Do, In Progress, Completed, Pending, and others as labeled by a team. Each column represents a workflow, that is, grouped tasks. For instance, every activity under the To-Do column is a workflow.

Even though visual cards can be grouped under columns, there is a maximum number of cards that a column must take. This is the WIP (Work in Progress) limit. Project heads can determine a WIP limit.

For instance, if a WIP limit is 3 and has been reached, your team should find a way to move the cards to new columns. This condition means that your team has to work more to contribute to the execution of each task.

The commitment point is when teammates pick up ideas that will aid a project’s success. Team members and customers submit these ideas to a backlog. A backlog is like an idea bank. When team members are ready to start work on a project, they pick up those ideas for use.

Team members are ready to end a Kanban’s workflow at the delivery point. At this stage, a project is delivered to the client. Teams often work hard on their lead time to get to this stage. The lead time is the time it takes to move from the commitment point to the delivery point.

Cross-Functional Flowchart

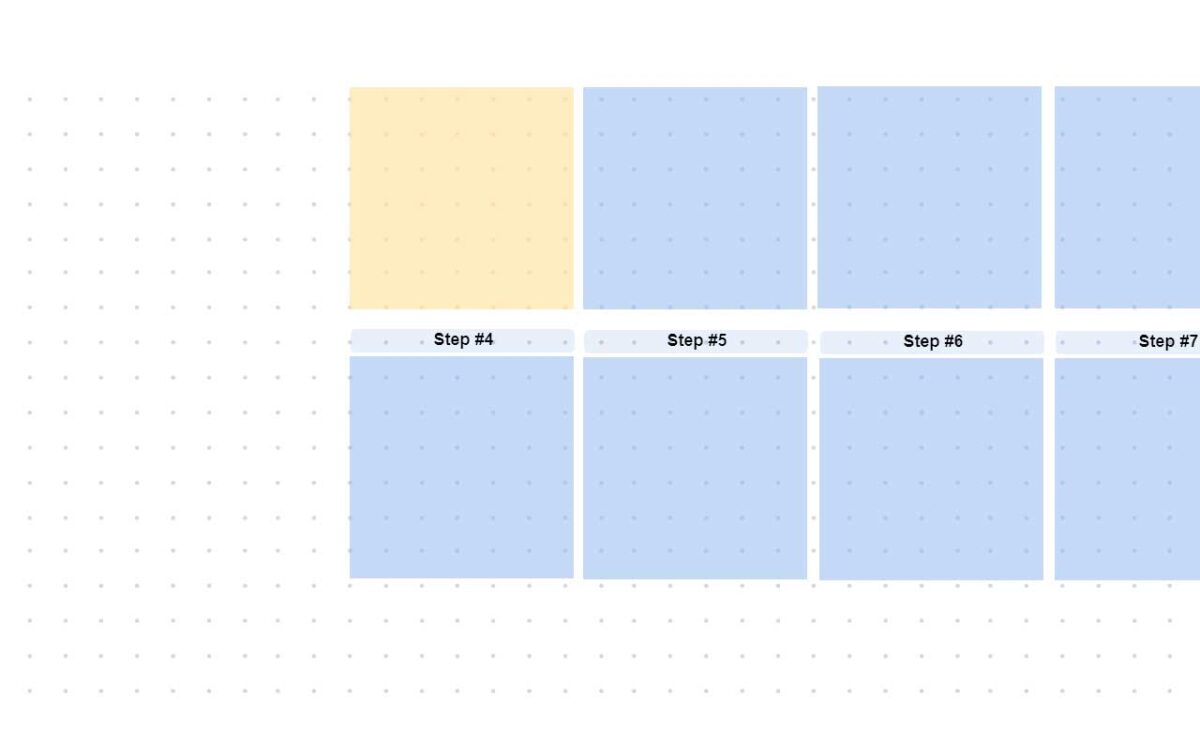
A cross-functional flowchart is a grid-like diagram divided into sections and indicates who does what, step flow and the decision-making process while managing projects.

It also indicates the relationship between various teams and processes. The diagram shows project stages, project owners, and project timelines. A cross-functional flowchart makes it effortless to involve or add numerous people to a project. The layout is easily understandable for team members.

When to Use a Gantt Chart

Every organization with a project can use a Gantt chart to manage tasks from the beginning to the final state. Still, some companies might be indecisive about using it. Here are a few indicators that a Gantt chart is for you.

Tough Deadlines

Hardly would teams complete their activities quickly when there is no deadline set. When there is a deadline, especially a tough one, your team can use a Gantt chart to keep track of time.

Multiple Team Members

Use a Gantt chart to manage those working on your project. In situations where there is a huge project involving many team members, a Gantt chart is suitable.

Visual Timeline

If your company has a client, team lead, or boss who cares to see a visual timeline of a project, you need a Gantt chart. This visual timeline helps them see how each team on the project is getting things done within the deadline.

Simultaneous Tasks

A Gantt chart should not only be used when multiple team members are working on a project. It can also be used when there are simultaneous projects at hand. It will help to manage their workloads.

Complexities

Tasks at times might include some intricacies. They could also require that some portions of a project be done in a certain way. A Gantt chart is a terrific option when it comes to handling complexities. a Gantt chart is a terrific option.

How to Create a Gantt Chart in Excel

Your team can create a simple Gantt chart in Excel. It is straightforward to create and is affordable. We shall outline how to create it in five easy steps.

  1. List all project tasks in column A.
  2. Write the start date for each task in column B and the completion date in column C.
  3. Column D is the duration of the task. The formula for calculating it is C2-B2 or C2-B2+1.
  4. Choose a 3-D horizontal layout in the bar chart option. That will give you a Gantt chart.
  5. Finally, put your data on the chart and format it to your taste.

In conclusion, Gantt charts are beneficial to companies that have projects to handle and focus on accurate and time-based delivery. If your company cannot afford to buy a Gantt chart software, that should not limit its project success as it can choose from several other alternatives. For simple projects, your company can create a Gantt chart with Excel.

Do you find this helpful? kindly read our next post on Gantt chart advantages

<a href=”http://<a href=’https://www.freepik.com/vectors/info-graph’>Info graph vector created by freepik – http://www.freepik.comFeatured Image

Categories:

Tags:

Fresco Logo

Fresco is focused on visual collaboration with a mission to expand the possibilities of teamwork online.

contact@frescopad.com

Categories

Recent Posts

Learn More

Scope creep is a term that refers to the expansion of scope throughout the course of a project. Learn how to avoid it by using Fresco.

A fishbone diagram is a template that breaks down problems in a way that helps teams identify and address the root cause of an issue.

The Agile methodology is a workflow that emphasizes cyclical improvements, collaboration, and frequent adaptation in order to solve problems.

Mind Maps present a unique solution to brainstorming and offer an intuitive structure to help you retain information. Learn more on Fresco.

Stakeholder mapping is the process of identifying, diagramming, and prioritizing stakeholders by analyzing their influence over and interest in a project

Online whiteboards do an incredible job connecting workspaces and engaging people in various collaboration activities. Learn more on Fresco.

Visual collaboration enables people to expand their connection globally, and unlock a world of new capabilities. Read to find out just what is possible.

With the workplace changing permanently, people must adapt to embrace virtual activities. Learn how to optimize your next virtual workshop at Fresco!

What is a Fishbone Diagram? Fishbone diagram (also known as the Ishikawa diagram) is defined as a ‘casual diagram’ methodology that aims to find root

What is Ansoff Matrix? Ansoff Matrix is defined as an enterprise growth planning method that aims to find new growth avenues. These growth avenues are

What is PESTEL Analysis? PESTEL analysis is defined as a business impact study that aims to understand the effects of 6 key external factors, which