How to Build a Gantt Chart

How to Build a Gantt Chart

Virtually every organization, if not all, ventures into project management from time to time. As a result, these organizations use tools that will simplify their projects and make them turn out to be a success. One of these tools is a Gantt chart. We have outlined how to build a Gantt chart in Excel. Here, we shall discuss the steps you must take to build a Gantt chart and how to create a Gantt chart on an online whiteboard.

Steps to Build a Gantt Chart

Creating a Gantt chart could be alien to you. Follow these steps and get started on the right path.

Design a Scope Baseline

A scope baseline will help your team monitor the result it envisages in contrast to the planned result. It is every activity that goes into your project execution. Teams often document the scope baseline in a scope statement, WBS (Work Breakdown Structure) and the WBS dictionary.

Here is how to create a scope baseline for your project; design a work breakdown structure, define the project scope, and have a scope statement. Then, get project stakeholders (clients and project heads) to approve the 3 documents in which the scope baseline goes.

Next, set up a management plan to monitor the scope. Since it is not a rigid plan, create a management plan for effecting changes when necessary.

Decompose

Decomposition in project management is the technique for breaking down projects into deliverables. This process will give your team insights into staying focused and managing time. Moreover, decomposing projects will show you the importance of each task, duration, and milestones.

Order Tasks

Breaking down projects is not enough. Your team members should arrange tasks in their order of dependencies. These task dependencies are Finish to Start (FS), Start to Start (SS), Finish to Finish (FF), and Start to Finish (SF).

Calculate Resources and Duration

Do an estimate of the human resources and material resources you need for your project. When you have done this, match them with tasks respectively.

Time is a vital factor in project management. So, to calculate your duration, confirm if there are enough resources and work equipment. Hence, you will be able to set a reasonable start date and the deadline for your team.

Create Schedule

Here is where you input all information into the Gantt chart. These bits of information include tasks, start date, end date, duration, and task dependencies, etc.

How to Create a Gantt Chart on an Online Whiteboard

How to build a grant chart 2

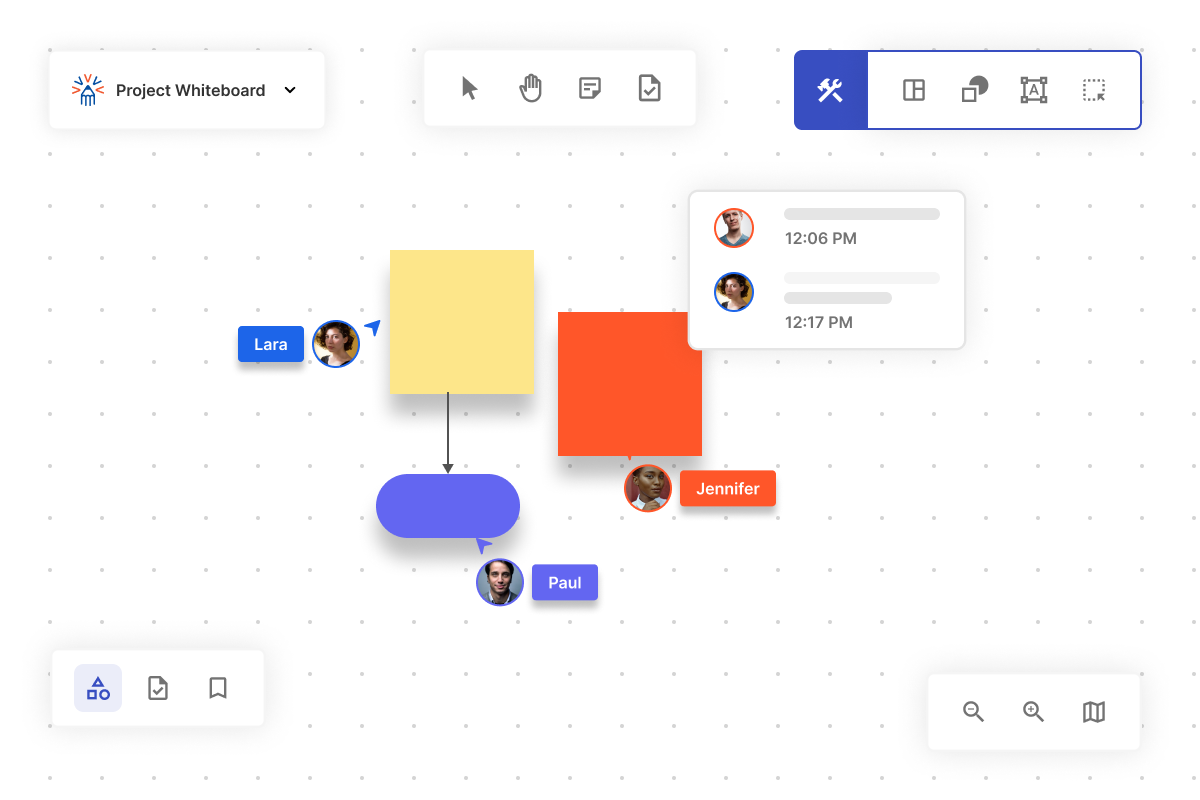
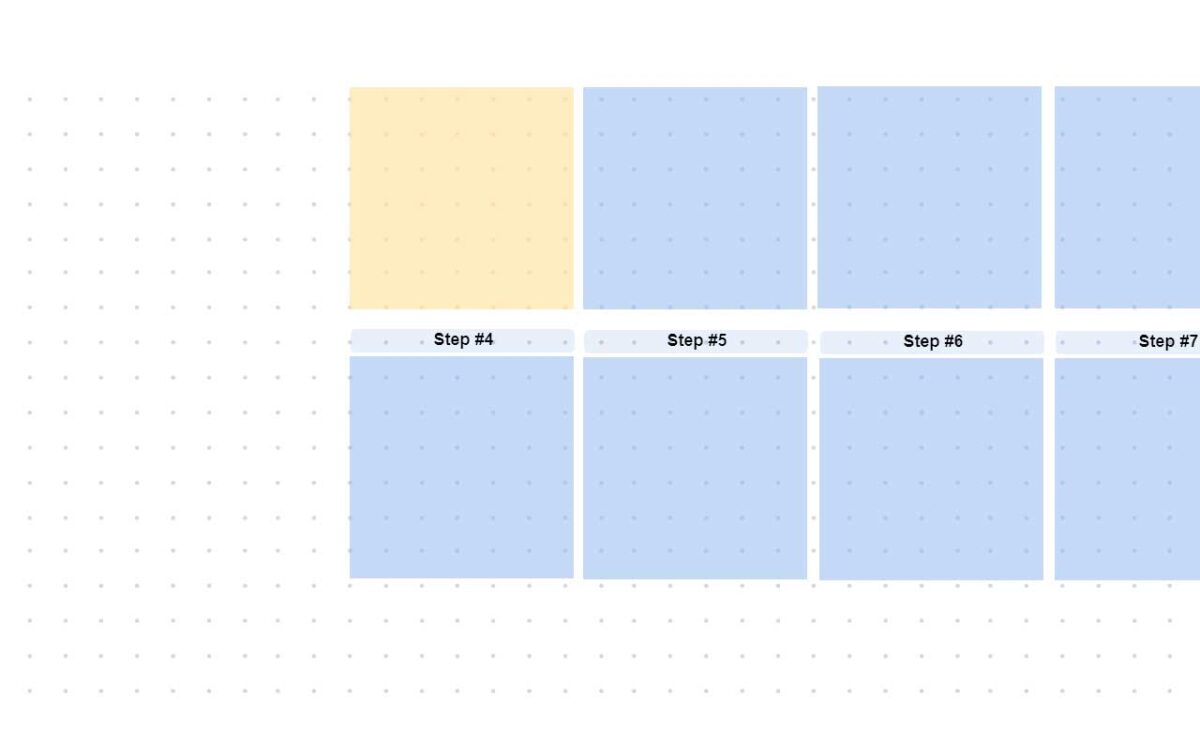
An online whiteboard lets team members collaborate and interact with each other in real-time. There are tons of online whiteboards you can use to create Gantt charts. However, we shall summarize the general ways to create a Gantt chart on an online whiteboard.

  1. Sign up with your credentials on the chosen virtual whiteboard.
  2. Select your preferred Gantt chart template in the software.
  3. Add all tasks, start date, and end date, etc., into the schedule.
  4. Connect corresponding dates to tasks.
  5. Assign each team member to a task or more.
  6. Customize the Gantt chart according to your brand style.
  7. Add team members to the chart. Make them collaborators. That way, they can make changes and see task progress.

Creating a Gantt chart is not complicated. Online whiteboards can help you manage your projects effectively and without hitches. With our board list, you can select from several templates to manage your projects. Sign up today.

Featured Image

Categories:

Tags:

Fresco Logo

Fresco is focused on visual collaboration with a mission to expand the possibilities of teamwork online.

contact@frescopad.com

Categories

Recent Posts

Learn More

Scope creep is a term that refers to the expansion of scope throughout the course of a project. Learn how to avoid it by using Fresco.

A fishbone diagram is a template that breaks down problems in a way that helps teams identify and address the root cause of an issue.

The Agile methodology is a workflow that emphasizes cyclical improvements, collaboration, and frequent adaptation in order to solve problems.

Mind Maps present a unique solution to brainstorming and offer an intuitive structure to help you retain information. Learn more on Fresco.

Stakeholder mapping is the process of identifying, diagramming, and prioritizing stakeholders by analyzing their influence over and interest in a project

Online whiteboards do an incredible job connecting workspaces and engaging people in various collaboration activities. Learn more on Fresco.

Visual collaboration enables people to expand their connection globally, and unlock a world of new capabilities. Read to find out just what is possible.

With the workplace changing permanently, people must adapt to embrace virtual activities. Learn how to optimize your next virtual workshop at Fresco!

What is a Fishbone Diagram? Fishbone diagram (also known as the Ishikawa diagram) is defined as a ‘casual diagram’ methodology that aims to find root

What is Ansoff Matrix? Ansoff Matrix is defined as an enterprise growth planning method that aims to find new growth avenues. These growth avenues are

What is PESTEL Analysis? PESTEL analysis is defined as a business impact study that aims to understand the effects of 6 key external factors, which