How Visual Thinking Enhances Collaboration

Visual thinking is a common strategy used by artists who need to diagram their thoughts and ideas. Visual collaboration allows not only artists, but everyone to take visual thinking online and flesh out any ideas they want to project. 

In this article, we will touch on what visual thinking is, while also talking about how it is applied in visual collaboration. If you’re interested in learning more about visual collaboration, check out our comprehensive guide, and if you’re looking to improve your team’s collaboration, read our list of tips.

Visual Thinking Definition and Applications

Visual thinking is a unique strategy of visualization that emphasizes organization and externalization. Our definition is as follows:

“Visual thinking is a strategy of thought organization that engages your ability to communicate and think creatively. It succeeds in conveying complex and intricate information and helps you further develop thoughts. Visual thinking emphasizes the use of physical tools to externalize your thoughts, making them easier to process and analyze.”

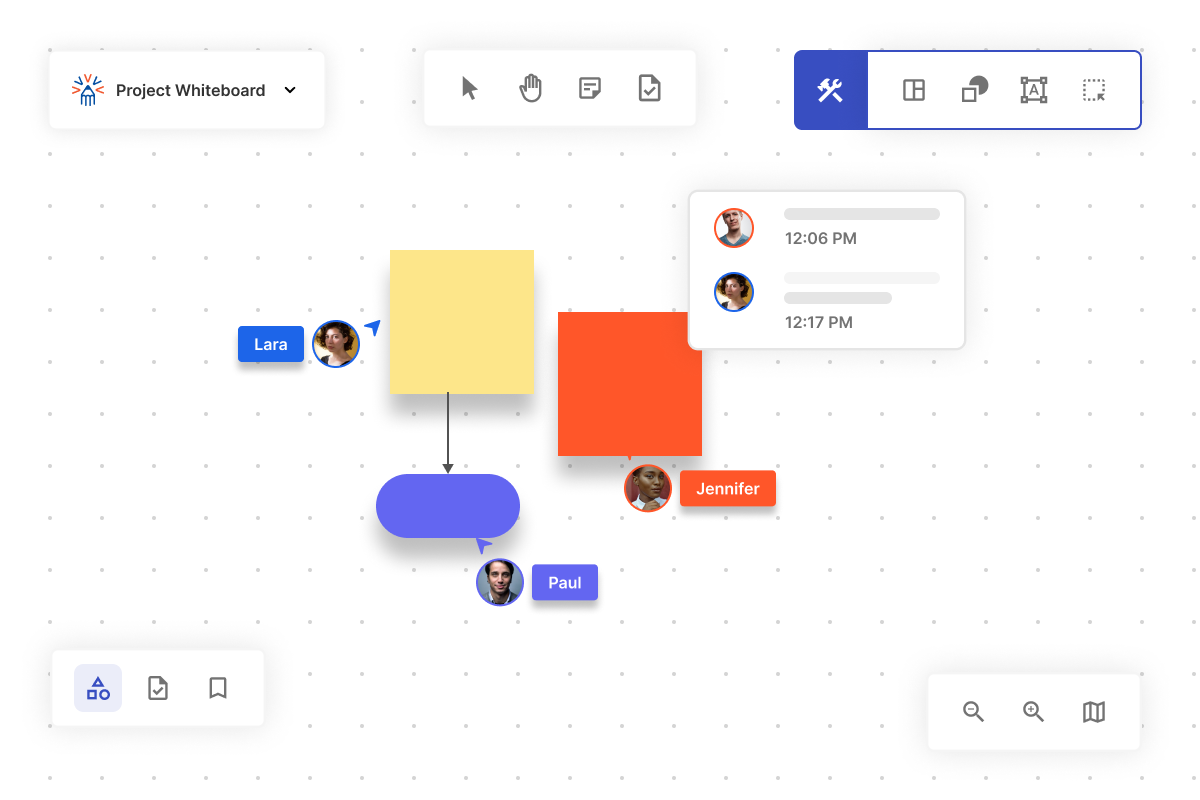
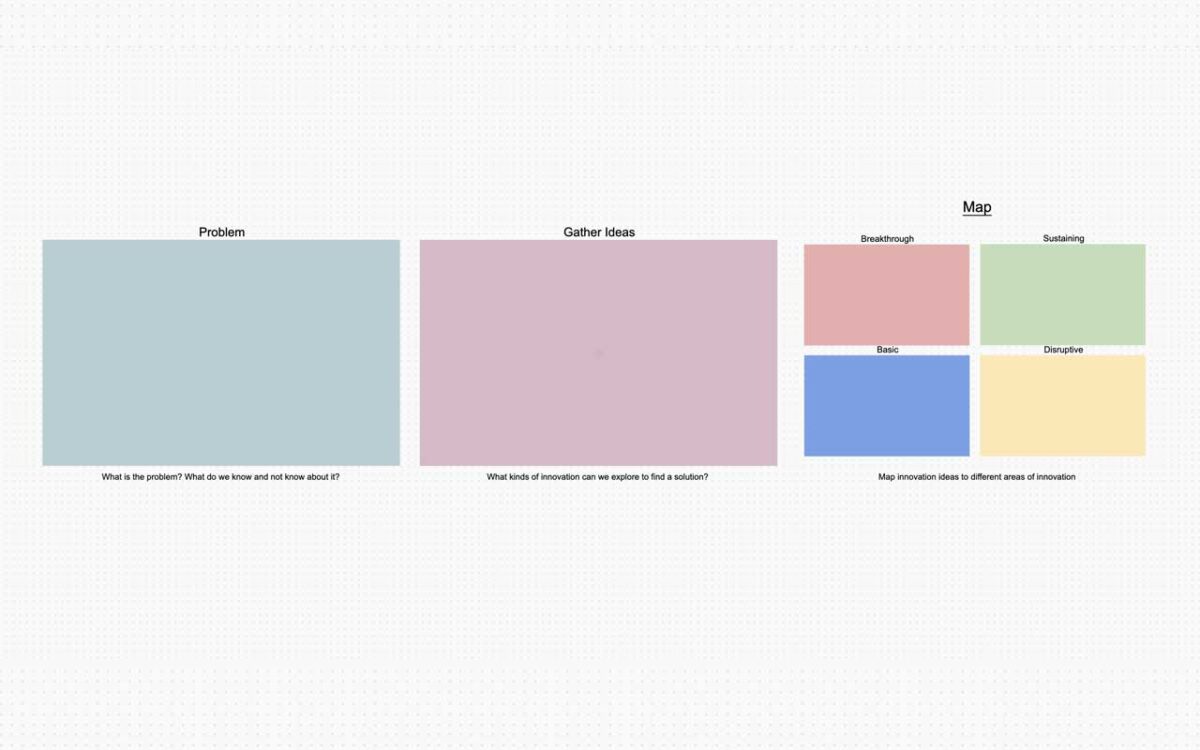
Image showing a person thinking of different and innovative solutions, a result of positive visual thinking.

People’s thought processes can get convoluted with the amount of information they are processing. This problem is exacerbated when working online when you have distractions and unlimited information at your fingertips. Distractions can be seen in brainstorming activities or creative outlets where the goal is to create and ideate many different solutions. During these activities, you can have many different options and ideas swirling around in your head, and often some of the meaning or some ideas get lost in this confusion.

Visual thinking is a great way of organizing these thoughts and demonstrating their direct value to the project at hand. Not only does visual thinking highlight the value of your ideas, but it also helps you evaluate which ideas lack direct value, which is another important outcome of the brainstorming process. Putting these ideas on paper means they can be better analyzed by yourself, and also better understood by your team.

Visual thinking is not synonymous with drawing – don’t get that confused. Visualization centers around the process of diagramming your thoughts in any physical manner, whether that be diagramming, lists, or any other form of thought organization. You don’t have to be good at art to gain from visual thinking, and if you are good at art you aren’t inherently using visual thinking correctly.

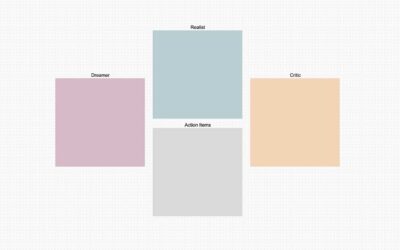
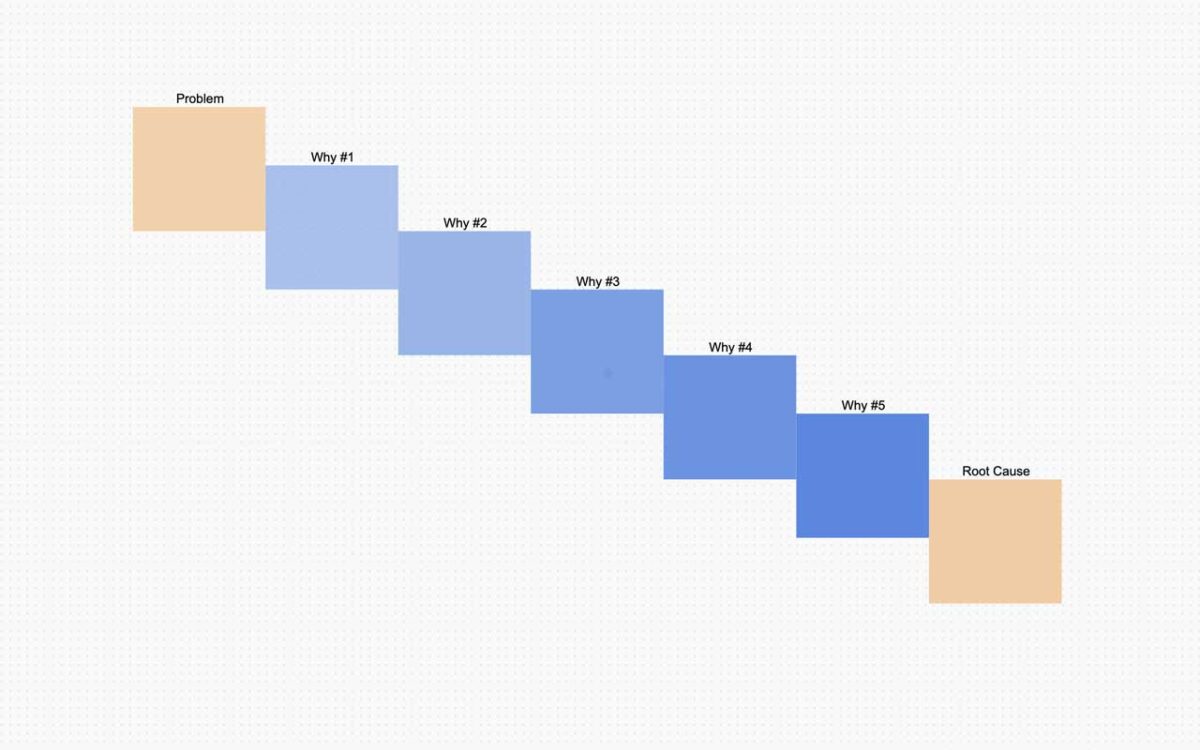
An image of a large map, displaying many different thoughts and diagrams, showing how visual thinking operates.

Visual thinking is very common to artists, people who need to diagram their thoughts and ideas to comprehend what they look like when actualized. Everything will always look different in your head than how it looks on paper, so physically seeing it can be really helpful.

Visual collaboration tools provide a great opportunity for other fields to utilize visual thinking strategies. These tools allow for the visualization of any activity or project, and on top of that, you can complete this visualization with a team of people. Working together with your team to visualize ideas and possibilities allows you to combine all of your thoughts and ideas in the same space, helping realize the actionable potential of each and every new idea.

Visual collaboration grants the possibility to perform visual thinking online, something that can be a great advantage to the collaborative process. Each member will have a better idea of what the others are thinking and processing, which helps establish critical thinking between members. 

Now that we have a solid understanding of this thought process, let’s highlight some helpful visual thinking strategies.

Visual thinking techniques

Affinity Diagrams

After finishing a brainstorming session you usually end up with loads of new information, ideas, and nowhere to put them. Visual collaboration tools are great organizers of content and ideas, and you can quickly build or utilize a pre-made affinity framework to organize the brainstorming you just completed.

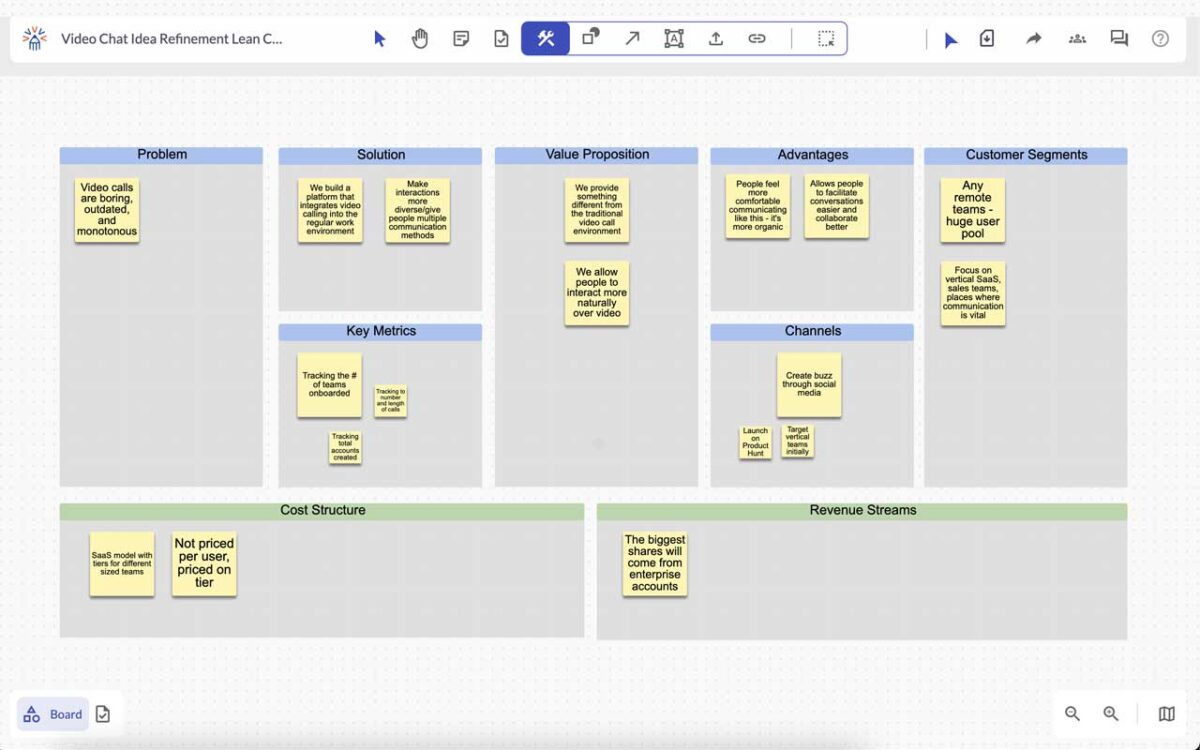
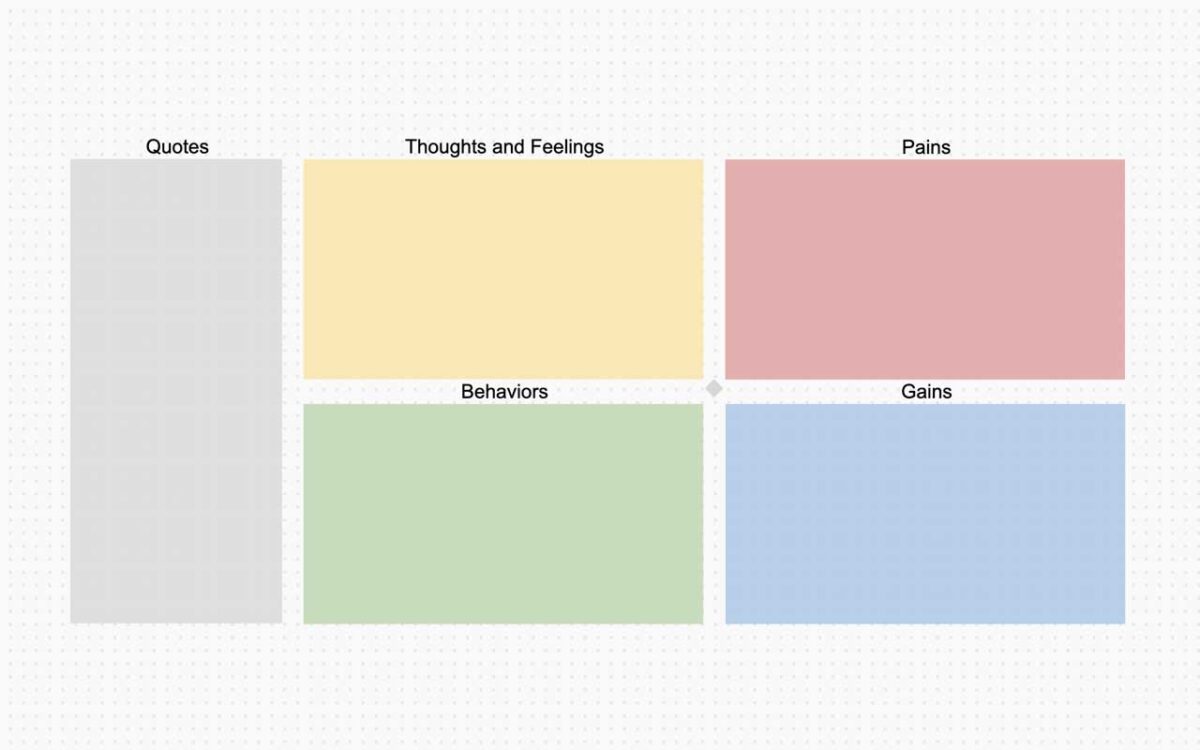
An example of an affinity diagram, a commonly used visual thinking strategy to organize thoughts.

Affinity diagrams help you group your thoughts based on categories, which could be based on the content you produced, what features they are related to, or when you plan on releasing them. Affinity maps help you visualize the next steps of your brainstorming/planning and do a great job organizing your thoughts. They make a fabulous visual thinking strategy and are very easy to pick up through visual collaboration.

Brainstorming Visually

Speaking of brainstorming, there are ways you can incorporate visual thinking strategies into your brainstorming activities to make them more productive and actionable. Brainstorming is a classic collaboration activity, and emphasizing visual elements can help develop new ideas.

A common issue with brainstorming is you can start the thought process with multiple different ideas but struggle to take them to fruition. Visualizing these ideas and thoughts can help you fully develop ideas instead of losing traction after thinking of multiple surface level ideas.

Especially for people that thrive through seeing their contributions and additions visually, this strategy can help push them to realize the potential behind their brainstorming. In this sense, visual collaboration helps demonstrate the potential of ideas to those who struggle to follow them to fruition.

Mind Mapping

Creating mind maps and journey maps are crucial evaluation metrics for people and companies to assess how effectively they reach customers and establish their customer’s needs.

During brainstorming sessions around customer beliefs, it can be incredibly helpful to implement visual thinking elements so people can see how their ideas and beliefs map out onto a designed template.

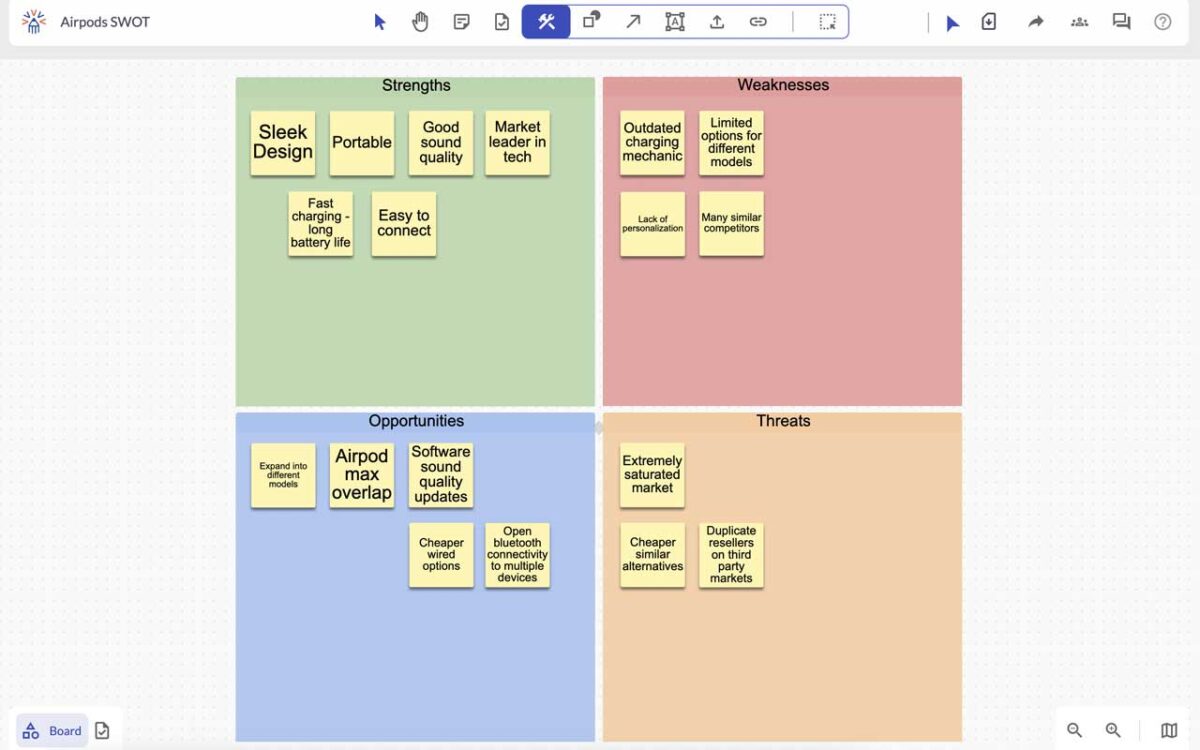
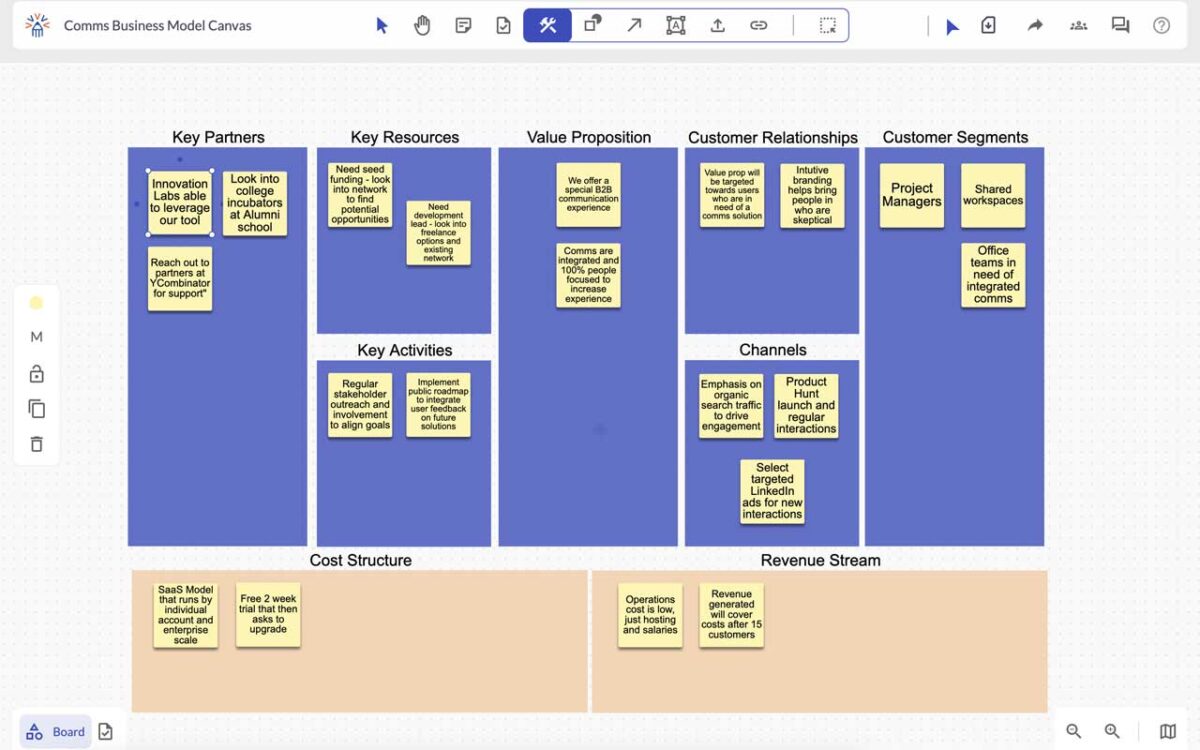
Example of a mind map, demonstrating a common visual thinking technique.

Visual collaboration tools provide a diverse array of templates for people to use to organize their mind maps and customer journey maps. Not only can you use a set of pre-made templates for organization, but these tools also allow you to easily translate your thoughts and maps onto a board of your creation. Creating a specific framework for your thoughts is easy and streamlined, and helps display all your information on a shared board.

Conclusion

Visual thinking is a powerful mechanism that is enabled by the versatility and collaborative ability of visual collaboration tools. Whether it be through diagramming on a canvas or simply using visual organization to structure your thought process, these strategies are employed with great efficacy through the use of visual collaboration tools.

Categories:

Fresco Logo

Fresco is focused on visual collaboration with a mission to expand the possibilities of teamwork online.

contact@frescopad.com

Categories

Recent Posts

Learn More

Scope creep is a term that refers to the expansion of scope throughout the course of a project. Learn how to avoid it by using Fresco.

A fishbone diagram is a template that breaks down problems in a way that helps teams identify and address the root cause of an issue.

The Agile methodology is a workflow that emphasizes cyclical improvements, collaboration, and frequent adaptation in order to solve problems.

Mind Maps present a unique solution to brainstorming and offer an intuitive structure to help you retain information. Learn more on Fresco.

Stakeholder mapping is the process of identifying, diagramming, and prioritizing stakeholders by analyzing their influence over and interest in a project

Online whiteboards do an incredible job connecting workspaces and engaging people in various collaboration activities. Learn more on Fresco.

Visual collaboration enables people to expand their connection globally, and unlock a world of new capabilities. Read to find out just what is possible.

With the workplace changing permanently, people must adapt to embrace virtual activities. Learn how to optimize your next virtual workshop at Fresco!

What is a Fishbone Diagram? Fishbone diagram (also known as the Ishikawa diagram) is defined as a ‘casual diagram’ methodology that aims to find root

What is Ansoff Matrix? Ansoff Matrix is defined as an enterprise growth planning method that aims to find new growth avenues. These growth avenues are

What is PESTEL Analysis? PESTEL analysis is defined as a business impact study that aims to understand the effects of 6 key external factors, which